Gold Coast or Sydney in January?
On climate data, Sydney comes out ahead overall in January. See the per-criterion details below.
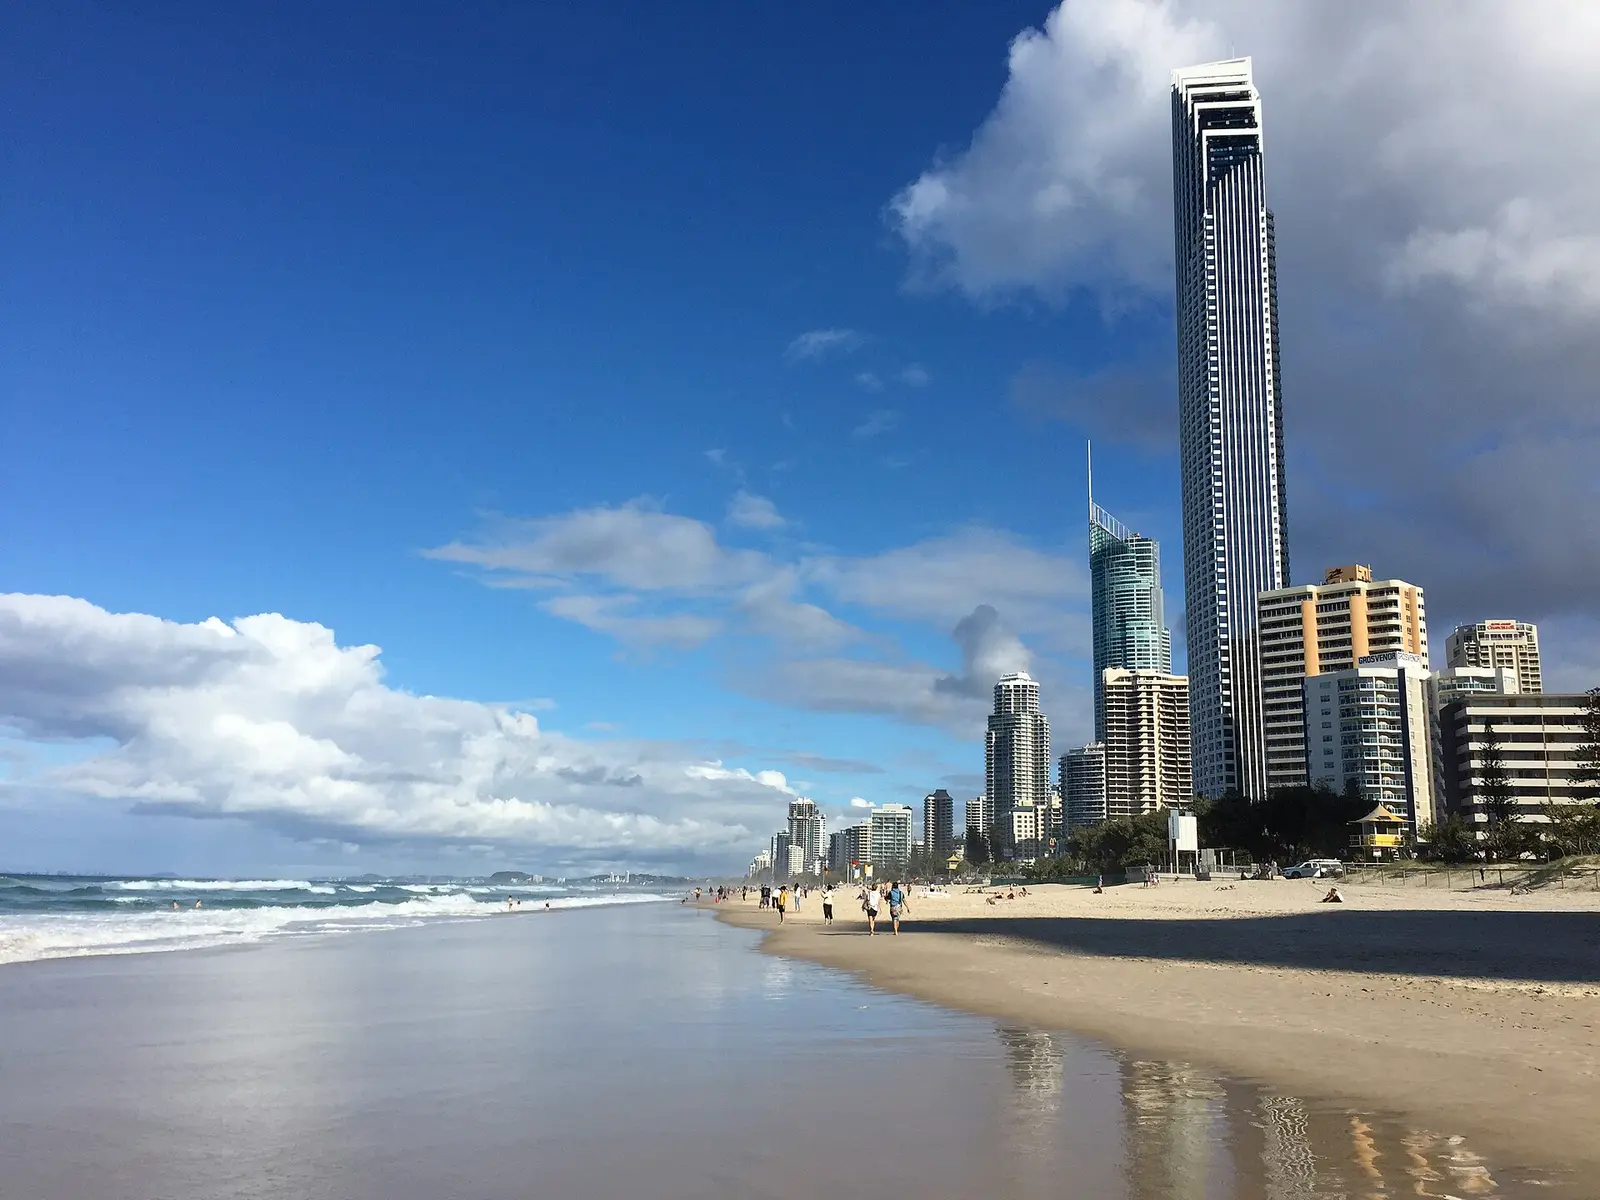 Gold CoastPhoto: Kgbo · CC BY-SA 4.0
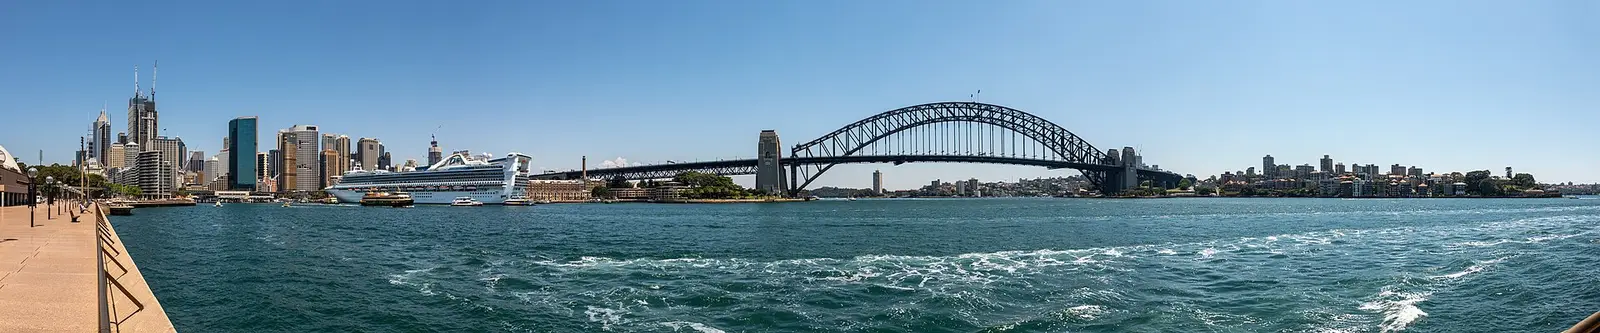 SydneyPhoto: Dietmar Rabich · CC BY-SA 4.0
Key figures in January
| Criterion | Gold Coast | Sydney |
|---|---|---|
| Average daily high | 30 °C | 26 °C |
| Average daily low | 21 °C | 20 °C |
| Sea | 26 °C ★ | 23 °C |
| Rainy days | 15 rainy days (est.) | 13 rainy days (est.) ★ |
| Sun | 8 h/day | 8 h/day |
| Humidity | 72 % | 75 % |
Winner by travel type
Trade-offs
- Gold Coast is about 4 °C warmer by day.
- Sydney is drier, with about 3 fewer rainy days.
- The sea at Gold Coast is about 3 °C warmer.
Gold Coast or Sydney in January: the short answer
In January, Sydney comes out ahead on the overall climate score (Gold Coast 67/100 vs Sydney 79/100). That is a snapshot of one month, though — which one truly fits depends on what you want from the trip, so the breakdown below goes criterion by criterion.
This comparison focuses on January as a representative month for the pair; for any other month, use each destination's month-by-month pages. Across the whole year Gold Coast averages a climate score of 76/100, Sydney 73/100. Both profiles below are historical monthly averages, not a forecast.
Weather in January, side by side
The average daily high is about 30 °C in Gold Coast and 26 °C in Sydney — warmer in Gold Coast. Average daily lows are around 21 °C versus 20 °C.
On rain, Gold Coast sees about 15 rainy days in January and Sydney about 13 — drier in Sydney. Sunshine is comparable (8 vs 8 hours a day).
Sea temperature and swimming
In January the water is about 26 °C at Gold Coast and 23 °C at Sydney — warmer for swimming at Gold Coast. Over the year, Gold Coast is comfortable for swimming (from ~21 °C) in January, February, March, April, May, June, July, August, September, October, November and December, Sydney in January, February, March, April, May and December. Peak sea warmth is February for Gold Coast and February for Sydney.
Rain and sun across the year
Over a full year Gold Coast records roughly 139 rainy days and Sydney about 121 — the drier of the two overall is Sydney. At their sunniest, Gold Coast reaches about 9 hours of sun a day (December) and Sydney about 8 (December). If dependable dry, sunny weather is your top priority, weigh these annual totals alongside the single month above.
Best time to visit each
Climatically, Gold Coast is at its best in April, August, September and October, while Sydney peaks in January, February, April and December. If your dates are fixed, pick the destination whose strong season overlaps them; if you are flexible, plan around these windows.
Which suits which kind of trip
Based on the January scores for each travel style:
Beach & swimming: Sydney scores higher in January (Gold Coast 81 vs Sydney 84).
City breaks: Sydney scores higher in January (Gold Coast 58 vs Sydney 79).
Active & hiking: Sydney scores higher in January (Gold Coast 46 vs Sydney 64).
Family: Sydney scores higher in January (Gold Coast 73 vs Sydney 82).
Verdict: which should you pick?
In January, Sydney leads across every scored category here — the overall score and each travel type — so on the climate data it is the clearer pick this month. Over the year, Gold Coast carries the higher overall climate score. Your own priority (sun, sea, low rain or sightseeing comfort) still matters, and the month-by-month pages for each destination give you the full picture before you book.