Iceland
Vík in February: weather, sea & travel advice
This month's data profile
Rain shapes the decision
Vík in February is climatically mixed. The average daily high is around 2 °C, and the sea is about 7 °C. With about 22 rainy days it is very wet.
Historical monthly averages, not a weather forecast. Individual days and years can differ substantially.
Rank among 12 monthly averages
10/100 · #9
Warmth
#10
Dryness
#9
Sun
#9
Sea warmth
#11
Published best categories: none
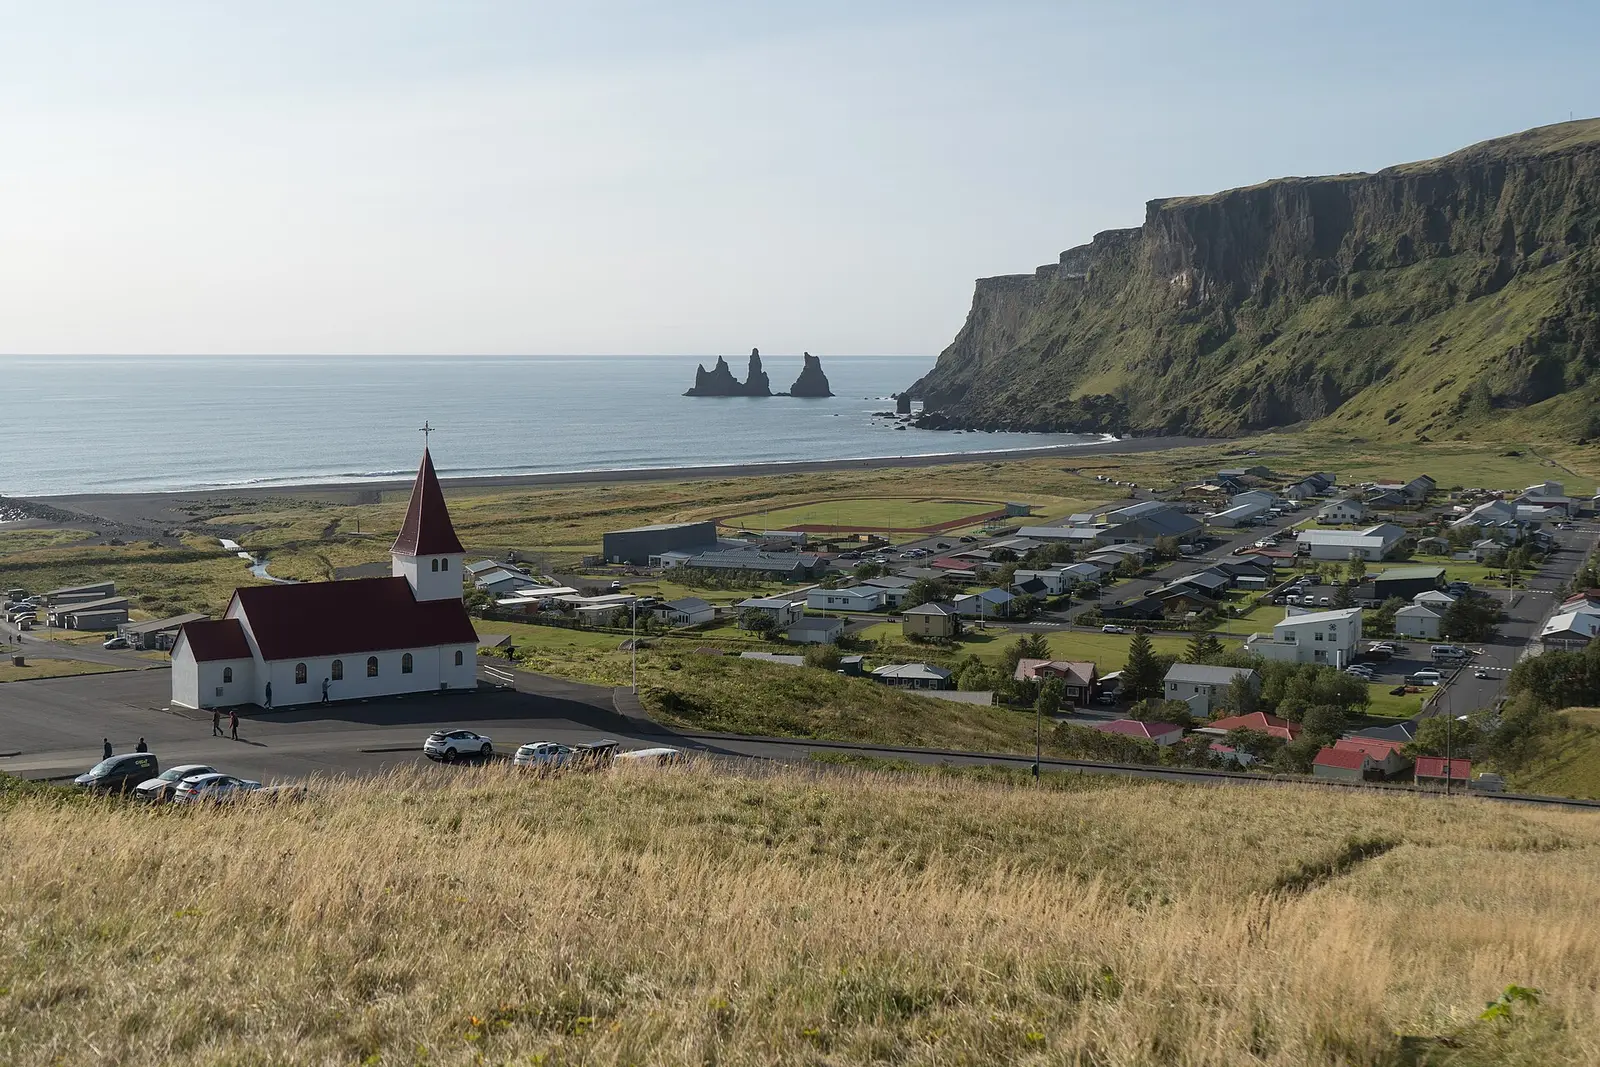 Vík · FebruaryPhoto: Alexey Komarov · CC BY-SA 4.0
Climate facts
- Average high
- 2 °C
- Average low
- -1 °C
- Sea
- 7 °C
- Rainy days (est.)
- 22 rainy days (est.)
- Sun (est.)
- 1 h/day
- Humidity
- 87 %
Climate evidence with direct month comparison
The highlighted row is the selected month. Precipitation total and rainy days are separate monthly averages.
| Month | Avg high °C | Avg low °C | Rainy days (est.) | Precipitation mm | Sun h/day (est.) | Humidity % | Wind m/s | Sea °C | Score |
|---|---|---|---|---|---|---|---|---|---|
| January | 2 | -1 | 23 | 243 | 0.2 | 88 | 6.6 | 8 | 8 |
| February (selected) | 2 | -1 | 22 | 239 | 0.8 | 87 | 6.7 | 7 | 10 |
| March | 3 | -1 | 22 | 220 | 2.2 | 86 | 6.2 | 7 | 12 |
How do the previous and next months compare?
Baseline: February (10/100)
Positive and negative values show the change from the selected month.
| Score Δ | Average high Δ | Average low Δ | Rainy days Δ | Rain Δ | Sun Δ | Humidity Δ | Wind Δ | Sea Δ | |
|---|---|---|---|---|---|---|---|---|---|
| January | -2 | -0.1 °C | ±0 °C | +1.4 | +4.1 mm | -0.6 h | +0.6 % | -0.2 m/s | +0.2 °C |
| March | +2 | +0.3 °C | +0.1 °C | +0.2 | -19.2 mm | +1.4 h | -0.6 % | -0.5 m/s | ±0 °C |
All twelve months in context
Find a place to stay
Where to stay in Vík
Compare available stays, prices and cancellation terms for Vík on Booking.com.
Booking.comFind places to stayAffiliate link: there is no extra cost to you.
Useful next decisions
Frequently asked questions
How warm is Vík in February?
The average daily high is around 2 °C, with an average daily low of about -1 °C.
Can you swim in Vík in February?
The sea is about 7 °C (cold).
Does it rain a lot in Vík in February?
The curated estimate is about 22 rainy days per month, not a directly measured long-term average. Total precipitation averages around 239 mm for the month. A rainy day does not mean all-day rain.
When is the best time to visit Vík?
No month in Vík reaches the threshold for a clear recommendation in the climate score; the month comparison above shows the differences.