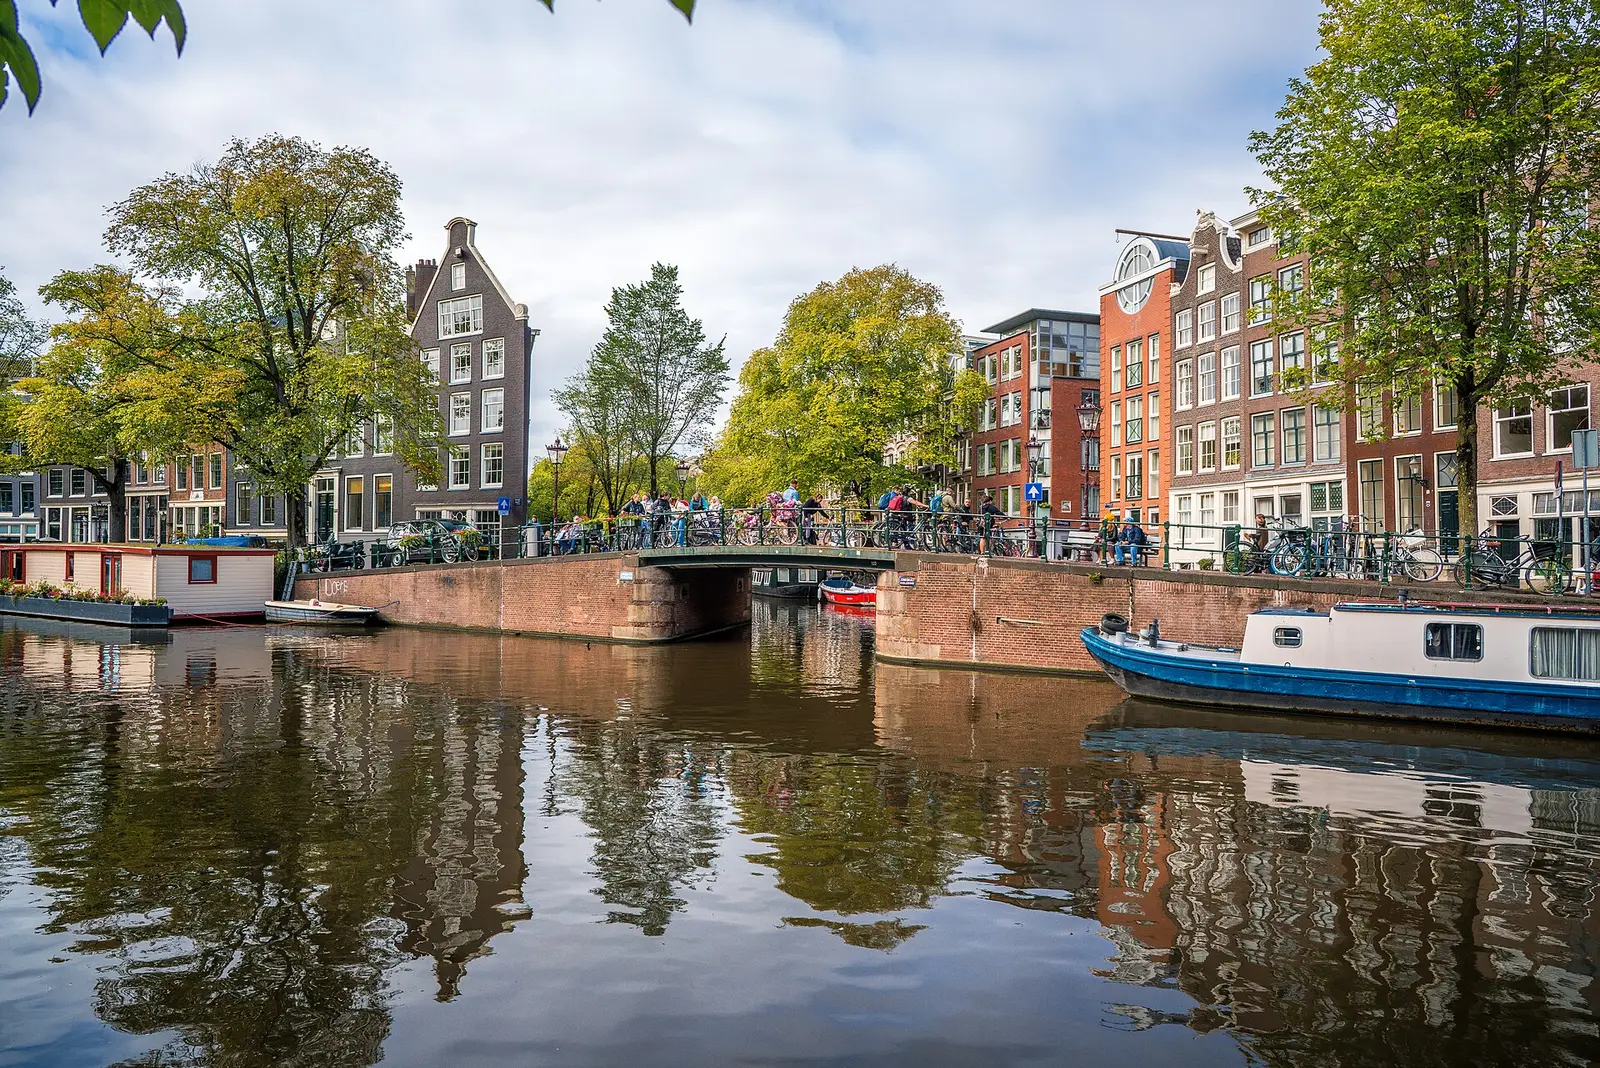
 AmsterdamPhoto: Nan Palmero from San Antonio, TX, USA · CC BY 2.0
Netherlands · Europe
Best time to visit Amsterdam
Amsterdam works year-round for city breaks. The climate is mild and damp with frequent wind; summers are pleasant, winters cool. Very bike-friendly.
Climate decision
Best travel months for Amsterdam
Top recommendation
Next highest scores
Historical monthly averages, not a weather forecast. Individual days and years can differ substantially.
Latest 5-year values 2021–2025
Average of the five most recent complete years compared with the 1991–2025 climate average.
August · Wet days
10.4 days/month
1991–2025: 13.7 days/month
-3.3 days/month · lower
June · Mean daily maximum
20.5 °C
1991–2025: 18.9 °C
+1.6 °C · higher
April · Monthly precipitation
58.4 mm/month
1991–2025: 44.4 mm/month
+14.1 mm/month · higher
June · Sunshine per day
7.4 h/day
1991–2025: 6.8 h/day
+0.6 h/day · higher
July: 3/155 days at or above 30 °C; highest single value 31.2 °C.
Five-year historical sample, not a weather forecast or long-term climate trend. Individual hot days can be far above the monthly mean.
Annual profile · City climate
Amsterdam: choose the season before the trip style
The lowest and highest average daily highs are 15.8 °C apart. Temperature is therefore the first decision layer, while rain and sunshine refine the choice of month.
How to read the curve
A single annual score hides the change of seasons. The useful question is which temperature window suits the planned city trip.
Lowest average daily low
February · 1.6 °C
Highest average daily high
July and August · 21.2 °C
Most rainy days
November · 16.1
Most sunshine
June · 6.8 h
For your trip planning
Amsterdam: canals, walks and a rain plan
A practical plan B
The Rijksmuseum and Foodhallen offer indoor options; covered canal boats provide another way to see the city in rain. Check the boat's facilities before booking. Not every canal trip offers the same weather protection.
Background: I amsterdam · Rainy-day activities
Do not make the whole day weather-dependent
Choose an outdoor activity and an indoor alternative rather than fixing every leg of the day. Monthly rain figures describe neither continuous wet hours nor a dry slot for your bike ride.
Month by month
Overall suitability per month. Tap a month for details.
All climate figures compared
The table is the complete accessible data view; the charts below highlight selected patterns.
| Month | Avg high °C | Avg low °C | Rainy days (est.) | Rain mm | Sun h/day (est.) | Humidity % | Wind m/s | Score |
|---|---|---|---|---|---|---|---|---|
| January | 5 | 2 | 14 | 74 | 0.9 | 91 | 5.0 | 23 |
| February | 6 | 2 | 12 | 62 | 1.8 | 90 | 4.8 | 31 |
| March | 9 | 3 | 12 | 53 | 3.3 | 86 | 4.3 | 37 |
| April | 12 | 5 | 10 | 44 | 5.2 | 82 | 3.8 | 52 |
| May | 16 | 9 | 12 | 60 | 6.5 | 80 | 3.8 | 59 |
| June | 19 | 12 | 12 | 65 | 6.8 | 80 | 3.6 | 68 |
| July | 21 | 14 | 14 | 73 | 6.6 | 80 | 3.5 | 68 |
| August | 21 | 15 | 14 | 79 | 5.6 | 80 | 3.5 | 69 |
| September | 19 | 12 | 13 | 76 | 3.9 | 82 | 3.8 | 61 |
| October | 14 | 9 | 15 | 84 | 2.2 | 86 | 4.3 | 41 |
| November | 10 | 6 | 16 | 84 | 1.0 | 90 | 4.4 | 25 |
| December | 6 | 3 | 15 | 81 | 0.7 | 92 | 4.8 | 22 |
Climate through the year
Compare temperature, rainy days, sunshine and, for coastal destinations, sea temperature month by month.
Find a place to stay
Where to stay in Amsterdam
Compare available stays, prices and cancellation terms for Amsterdam on Booking.com.
Booking.comFind places to stayAffiliate link: there is no extra cost to you.
Useful next decisions
More comparisons
Similar destinations
The number is the overall climate score, not a similarity score.
Frequently asked questions
When is the best time to visit Amsterdam?
The strongest climate months are June, July, August, September. Values are historical averages, not a forecast.
Which month has the highest average daily maximum temperature in Amsterdam?
Average daily maximum temperatures in Amsterdam are practically tied in July and August at around 21 °C.